Debugging 101
JavaScript Debugging with Firefox
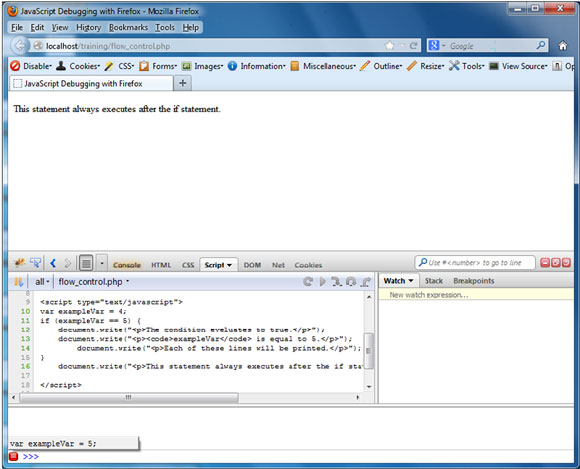
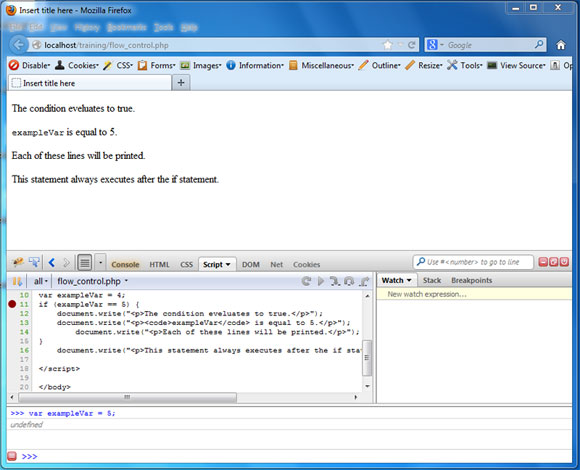
In this tutorial I’ve started with a simple decision making script: an if statement. There are two statements contained within the if statement’s command block, and one outside of the command block. The text you see in this first screenshot is the result of executing the statement below the command block. It executes after the if statement is evaluated whether or not the conditional expression evaluates to true. In other words, it’s not part of the if statement at all. It’s a completely independent statement.
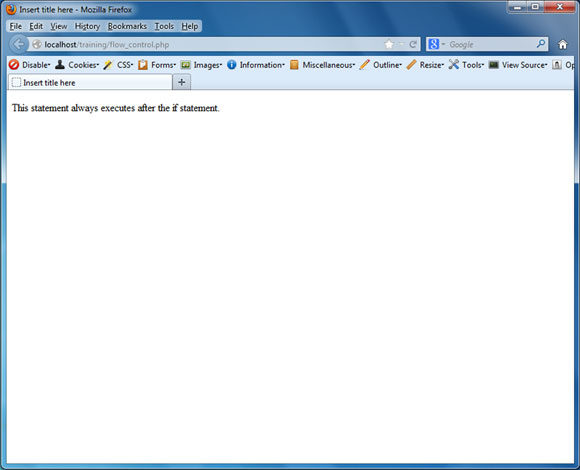
This 2nd image shows the Firebug plugin activated. The left section shows the HTML, the right section shows the styles, and the bottom section is a command line tool that you can use to add code to the script. I’ll go into a little more detail about that in a few more steps.

I’m going to click on the Script tab, and you’ll notice an alert letting you know that the script panel was inactive during the page load. Simply click the "Reload" hyperlink to display the scripts.
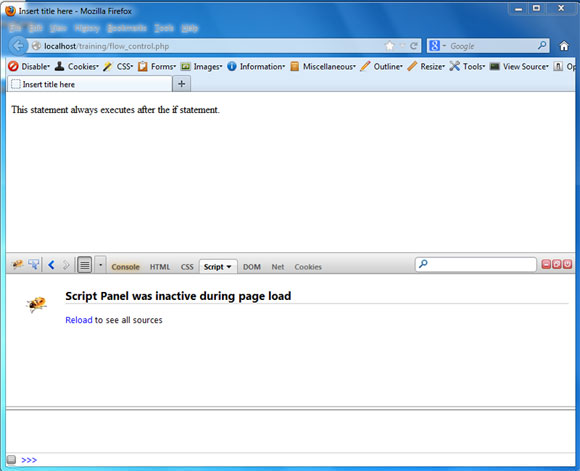
Typically you”ll keep your script in an external .js file, but for this exercise, I just added the script to the body. That’s why you see the HTML file in the script window.

I’ve scrolled down so that our entire script section is visible in the window.
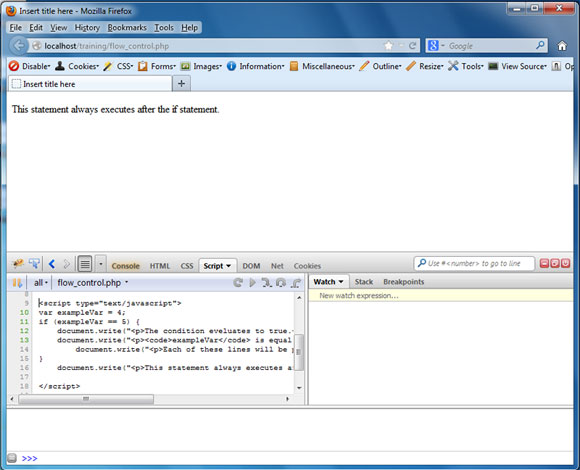
The red dot to the left of line number 11 is a break point. A break point is simple a place where you tell the script to pause execution. In firebug you need to reload the page once you’ve set your breakpoint. You can do that by clicking on the refresh icon to the right of the address bar, pressing the F5 key on a PC, or holding the command button while pressing the R key on a Mac.
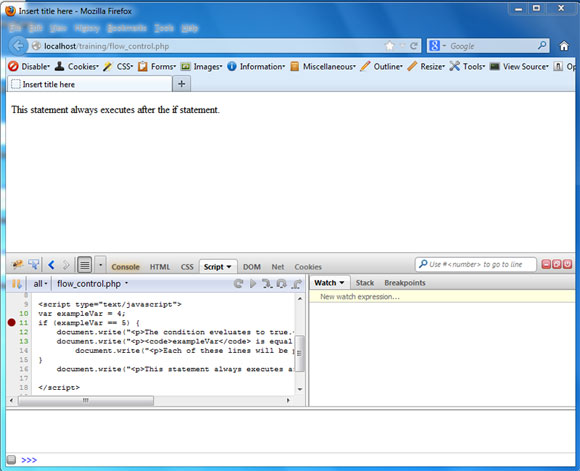
Once the page is refreshed you’ll notice the blue and orange icons are illuminated just above and to the right of our code. The first orange button is the "Step Into" button. It begins at your breakpoint and executes your code one line at a time until the code has finished executing. You’ll notice the variable "exampleVar" has been declared and given a value of 4. The condition in the if statment evaluates to true if the variable exampleVar equals 5. That’s why the three "write" statements didn’t execute. Here’s where we get to see the power of the command line.
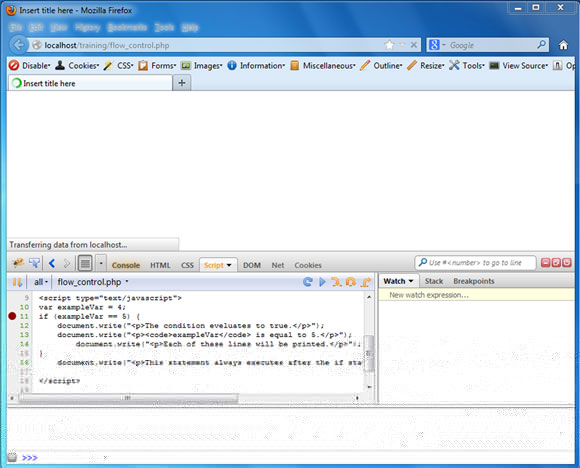
At the very bottom of the screen I’ve enetered "var exampleVar = 5;". If you’ll remember from the previous step, the break point stopped our code just before the "if statement" is evaluated. That means that we can change the value of the variable to match the condition of the if statement. Why is this so powerful you ask? Well, what it means is that you can modify your code and fix it without needing to go back into your IDE or HTML/Script editor. For this example I used the Eclipse IDE. If you’re not familiar with it, it’s essentially the IBM equivalent of Visual Studio. It’s an incredibly robust IDE, and best of all, it’s free.
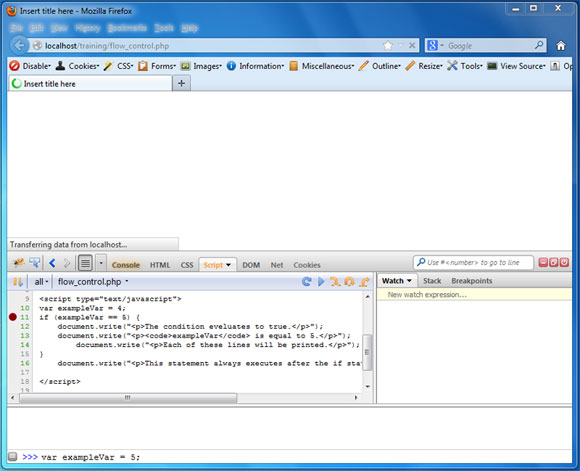
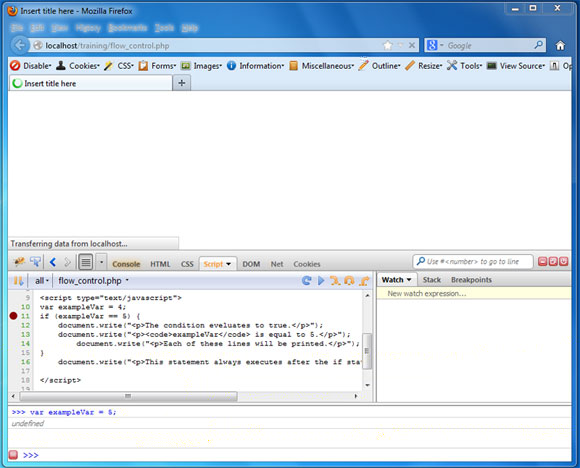
Once I’ve typed the code and hit the enter key, the code now displays in blue. It’s temporarily stored until the page is refreshed.
One more thing you’ll notice is the awkward indentation of the last statement in the "command block". I did that on purpose to show you another powerful feature of Firebug. Firebug not only tells you about your errors, it shows you exactly where they are in your IDE interface. We’ll learn more about that a little further down.
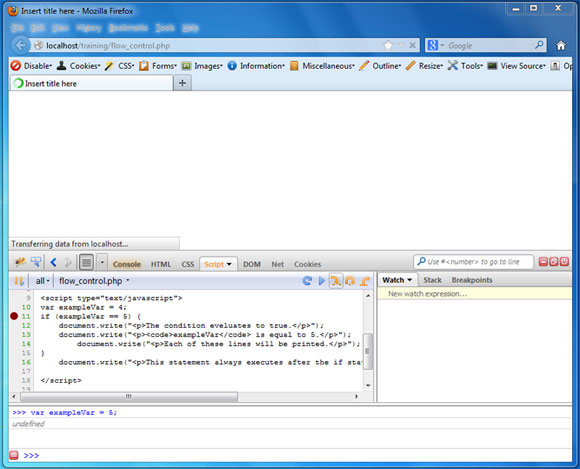
As I step through the code, give careful attention to the window on the right. It shows that the variable now has a value of 5. That’s the direct result of the extra code I typed into the command line. Pretty cool huh?
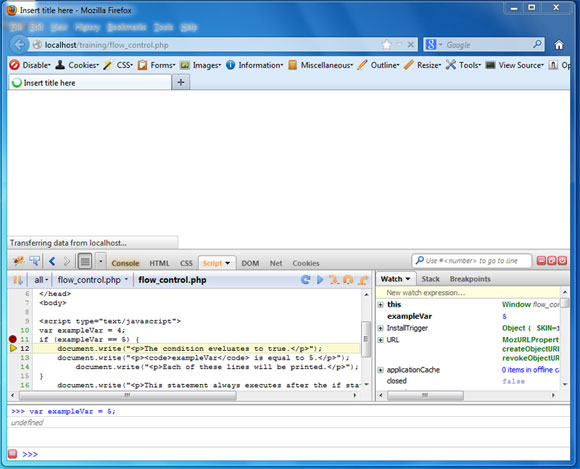
As I step through the fist statement in the command block, you’ll notice in the regular browser window that it executed and wrote the text to the browser.
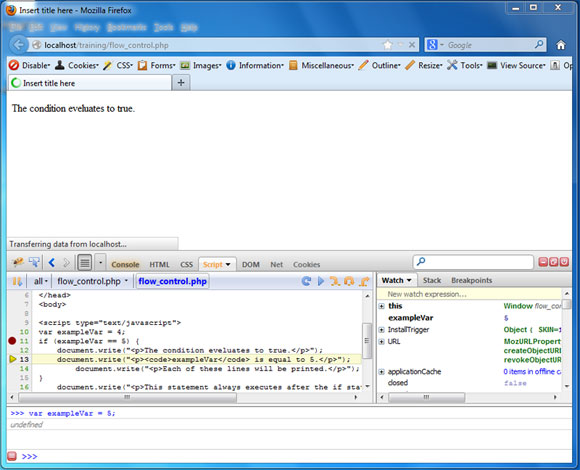
As I step through the next statement, you’ll notice that it too writes to the browser window. One difference is that I used the "code" tag to cause it to stand out from the rest of the text.

As I step through the 3rd and final statement within the command block, you’ll notice that it prints in the browser window as well.
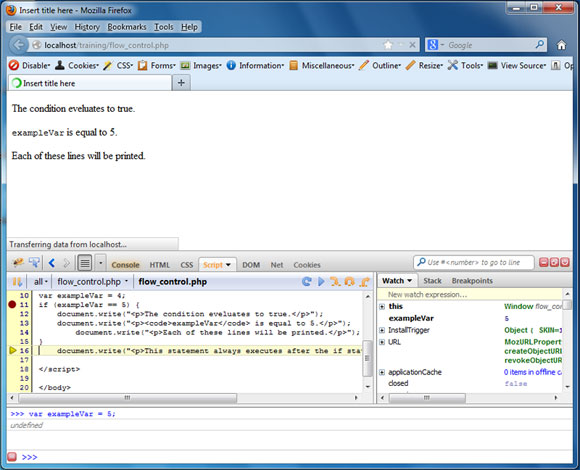
Finally, we’ll step throught the final statement in our code
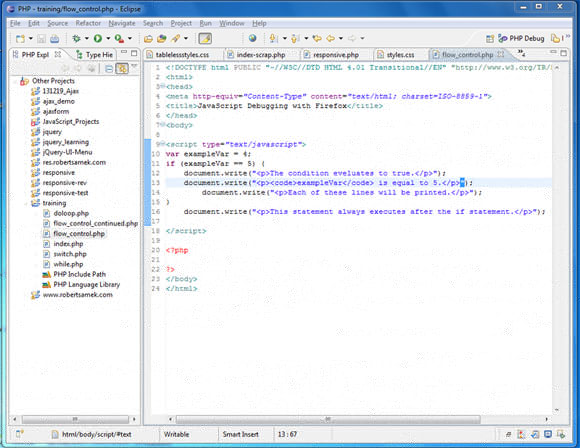
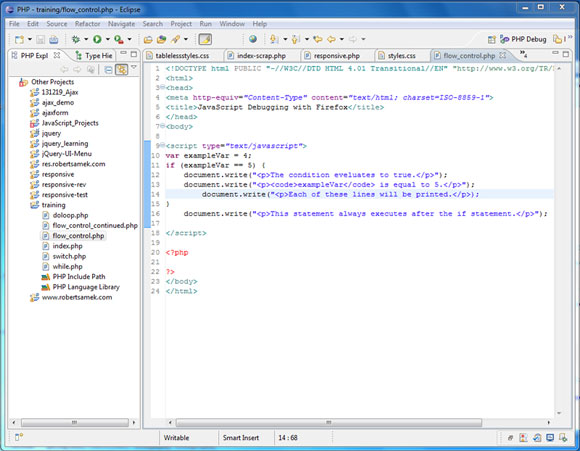
Now we’ll get to the part about the oddly indented statement. The picture below shows the page opened up in Eclipse. I’m going to delete the quotes in the 2nd string within the command block.
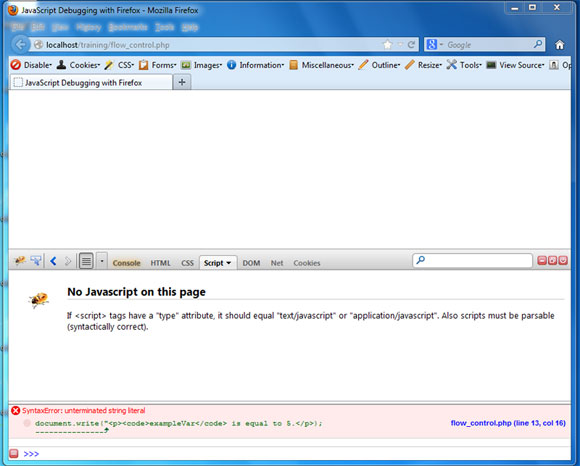
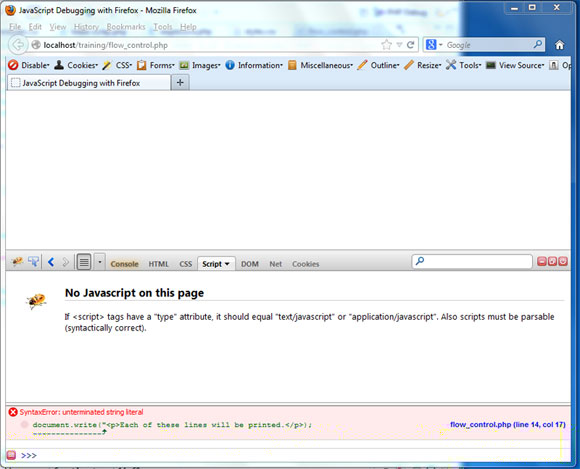
When I reload the web page, you’ll notice that there’s a syntax error displaying at the bottom of the screen. It reads "unterminated string literal". That means that there’s a string that doesn’t include the closing quotes within our statement. The entire statement is displayed, and there’s an arrow pointing to the opening quote. If you look to the right of the statement you’ll notice blue highlighted text. It displays the name of the file with the error and tells us that the error begins at line 13 and column 16.
If we go back to the page in the Eclipse IDE, we can see that line 13 is the location of the unterminated string displayed in the Firebug error window. If you place the cursor at the beginning of line 13 and move it 16 spaces (hence the 16 columns noted in Firebug), it lands right on the opening quotes. I added a tab space for the 3rd statement within the command block. lets see what happens when I remove the terminating quotes from it’s string.
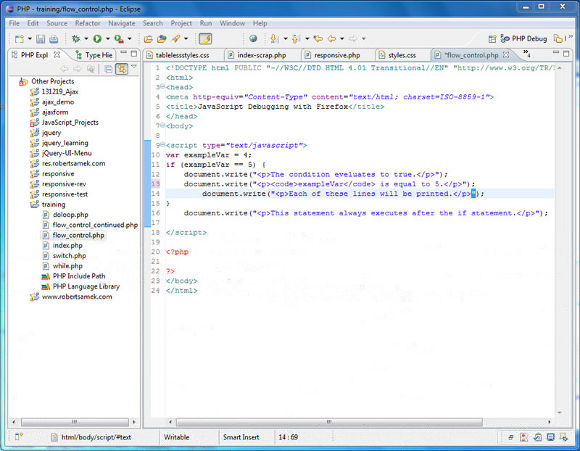
Voila. Exactly what we would expect to see. The blue error locating text reads line 14 and column 17. If the 3rd statement was indented just like the 2nd, it would read column 16. We added what looks like several spaces, but it’s actually only 1 tab space.
You can test it by going back into your code editor and setting the cursor at the beginning of the line, then counting the spaces.
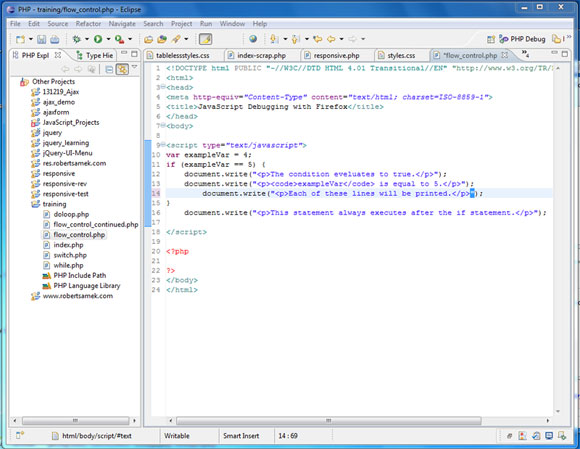
We’ll add our closing quote back which fixes our code.
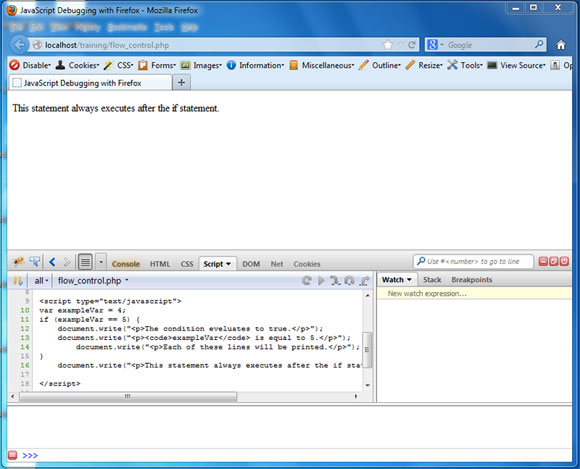
When we reload the page, there aren’t any errors.
One more thing worth mentioning is the command line history button. If you click on the red button at the bottom left of the window, it shows you the history of the commands you entered. I think you can get a taste of why so many developers use Firebug as their primary JavaScript debugger. Feel free to contact me with any additional questions and thanks for viewing my tutorial!
